Charging Speeds & Curves Explained
Looking beyond peak kW ratings: understanding the chemistry and engineering that dictates how fast an EV actually recharges on a road trip.
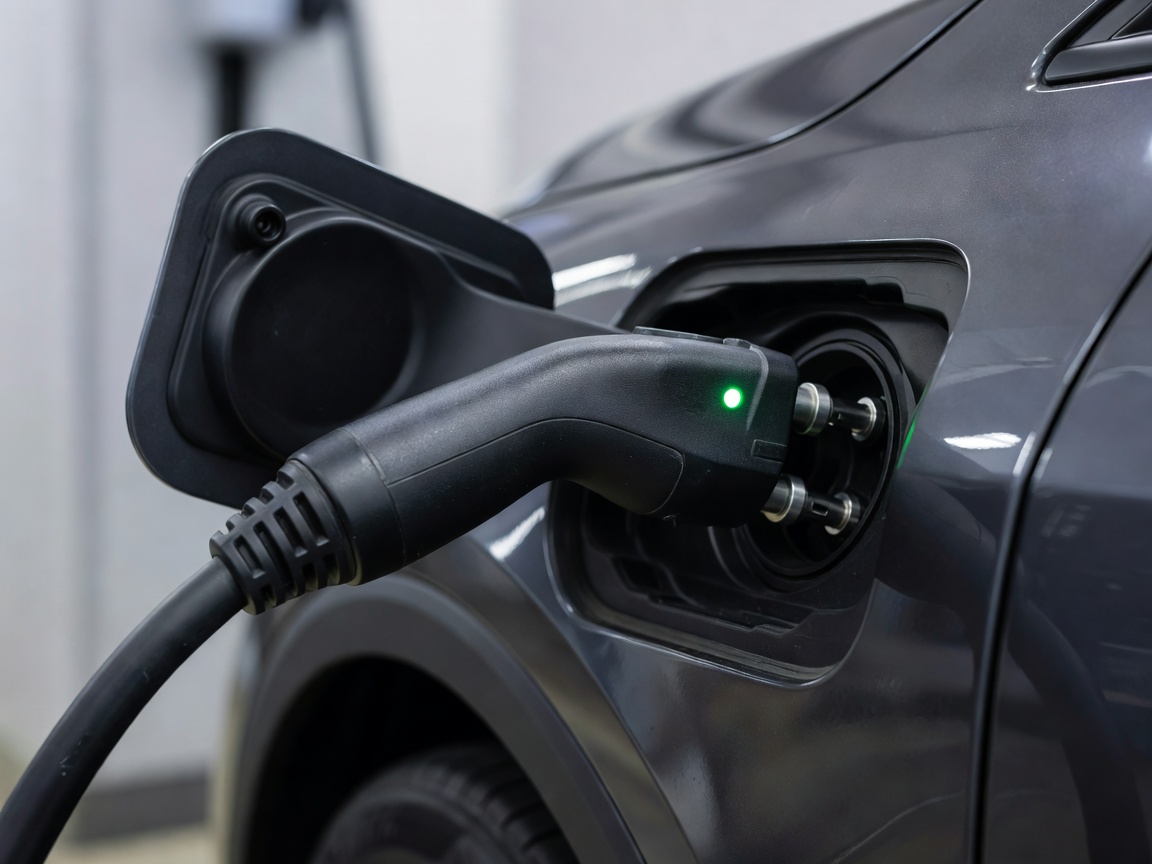
One of the most misunderstood aspects of electric vehicle ownership is the concept of charging speed. Manufacturers heavily advertise "peak charging rates" (e.g., 150kW, 250kW, or 350kW), leading many to assume that a vehicle will absorb power at that maximum rate from 0% all the way to 100%. In reality, battery chemistry dictates a much more complex process known as the charging curve.
The Fallacy of Peak kW
Peak kilowatts (kW) indicate the absolute maximum power a vehicle's battery management system (BMS) will accept under perfect conditions. However, this peak is usually only sustained for a brief window—typically between a 10% and 30% state of charge (SoC). As the battery fills, internal resistance increases, and the risk of lithium plating (which permanently damages the battery) rises.
To protect battery longevity, the BMS artificially throttles the incoming power. This creates a tapering curve. A vehicle boasting a 250kW peak might drop to 100kW by the time it reaches 50% SoC, and plummet to a mere 30kW as it approaches 80%.
Average Speed vs. Peak Speed
When evaluating an EV for a road trip, average charging speed across a specific window (usually 10% to 80%) is a far more critical metric than peak speed. A vehicle with a flat charging curve that sustains 150kW continuously up to 70% will complete a charging session significantly faster than a vehicle that spikes to 250kW for three minutes before throttling down to 80kW.
This is why experienced EV drivers adopt the "ABC" (Always Be Charging) or "splash and dash" strategy. Instead of waiting for the battery to hit 100%, it is much faster to arrive at a charger with a low SoC (e.g., 10%), charge rapidly in the high-acceptance window up to 60% or 70%, and immediately continue driving to the next station. Time spent charging past 80% on a fast charger is largely wasted time.
The 400V vs. 800V Architecture Divide
The speed at which power is transferred is defined by the equation: Power (Watts) = Voltage (Volts) x Current (Amps). Because charging cables can only be so thick and liquid cooling systems can only dissipate so much heat, there is a physical limit to the current (Amps) a standard CCS connector can carry—usually around 500 Amps.
Most early EVs utilized 400-volt architectures. At 400V and 500A, the mathematical limit is 200kW. To push beyond this and achieve ultra-rapid charging times (sub-20 minutes for a 10% to 80% charge), manufacturers have begun migrating to 800-volt architectures. Notable examples utilizing 800V platforms allow the vehicle to accept double the power at the same amperage, easily enabling 250kW to 350kW charging rates with thinner, lighter cables.
Thermal Bottlenecks
Finally, the charging curve is heavily influenced by thermals. Fast charging generates massive amounts of heat. If the vehicle's cooling system cannot shed this heat fast enough, the BMS will enforce a harsh reduction in charging speed—a phenomenon known as "thermalgate." Conversely, a cold battery cannot accept high power. This makes battery preconditioning (actively heating the pack before arriving at a charger) an essential feature for maintaining an optimal charging curve during winter road trips.